AI-powered data visualization tools are the modern-day explorers equipped with powerful algorithms to unearth those hidden gems and transform them into stunning visual narratives that even the most data-averse can understand.
In this guide, we’ll unveil the top AI-powered tools that are revolutionizing how businesses make sense of their data. We’ll explore how these tools go beyond simple charts and graphs, leveraging artificial intelligence to reveal insights that might otherwise remain buried. Get ready to elevate your decision-making, optimize your operations, and unlock a world of data-driven possibilities.
What is Data Visualization?
Data visualization is the art and science of transforming raw data into visual representations that are aesthetically pleasing and easy to understand. It’s like translating a complex novel into a captivating movie — you get the same story, but it’s delivered in a way that’s more engaging, intuitive, and memorable.
Think of those colorful charts, informative graphs, and interactive dashboards that pop up in your business meetings or social media feeds. Those are all examples of data visualization in action. They take complex numbers, statistics, and trends and transform them into visual formats that help us grasp the underlying patterns, relationships, and insights.
Data visualization is about enhancing our ability to understand and communicate data, enabling us to make informed decisions, identify opportunities, and solve problems more effectively. Whether you’re tracking sales performance, analyzing customer behavior, or monitoring market trends, data visualization is a powerful tool that can help you see the big picture and make sense of the details.
What’s so Great About AI Data Visualization Tools?
AI data visualization tools are the rocket boosters of data analysis, propelling your understanding of complex information to new heights. They’re not just about making your data look pretty; they’re about unlocking the hidden potential within it. Here’s what makes them so great:
- Unprecedented Speed and Efficiency
AI algorithms can crunch massive datasets in a fraction of the time it would take a human analyst. This means you can get insights faster, make decisions quicker, and seize opportunities before they vanish.
- Uncover Hidden Gems
AI tools are like data detectives, unearthing subtle patterns, correlations, and anomalies that would otherwise remain invisible to the naked eye. This gives you a deeper understanding of your data and helps you make more informed decisions.
- Predict the Future
AI tools can analyze historical trends and forecast future outcomes with surprising accuracy. This gives you a competitive edge by allowing you to anticipate market changes, customer behavior, and potential risks.
- Customizable and Tailored Insights
AI tools don’t just give you generic charts and graphs. They tailor visualizations to your specific needs, highlighting the most relevant metrics and insights for your business. This ensures that you get the information you need when you need it.
- Democratization of Data
You don’t need to be a data scientist to use AI data visualization tools. Their user-friendly interfaces and natural language processing capabilities make them accessible to everyone, empowering your entire team to make data-driven decisions.
- Enhanced Collaboration
Many AI tools offer collaborative features, allowing teams to collaborate on data analysis and share insights seamlessly. This fosters a culture of data-driven collaboration and innovation within your organization.
- Improved Decision-Making
By providing clear, concise, and visually compelling insights, AI data visualization tools help stakeholders at all levels understand complex information and make informed decisions that drive business success.
In short, AI data visualization tools are the secret weapon for businesses looking to harness the full power of their data. They empower you to see beyond the numbers, make better decisions, and ultimately achieve your goals faster and more efficiently.
Top AI-Powered Data Visualization Tools You Need to Know
The AI-powered data visualization industry is brimming with innovation, offering a wealth of options for businesses of all sizes and industries. However, a few tools have carved a niche for themselves as true game-changers, transforming the way we interact with and glean insights from data.
1. Tableau

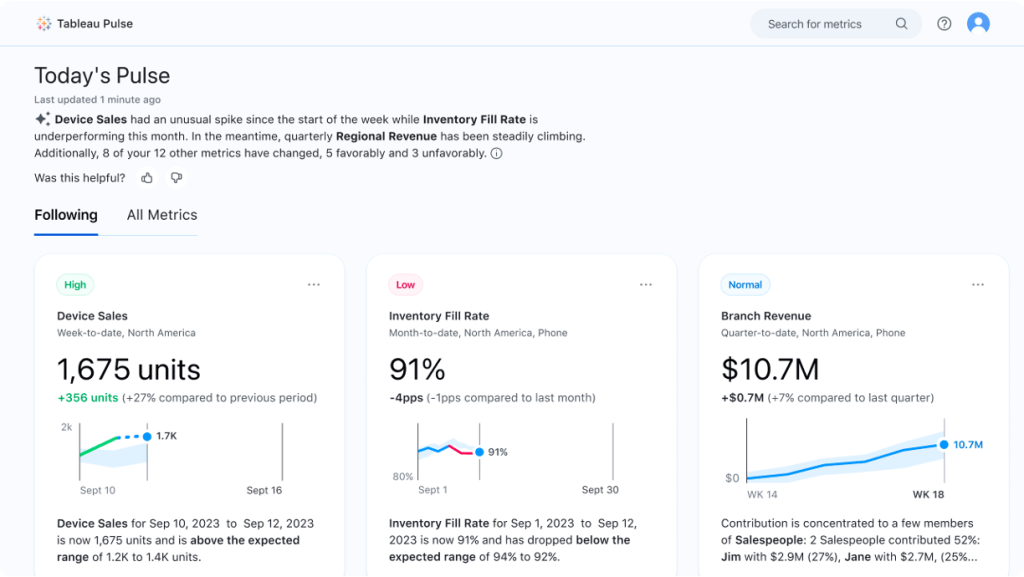
Tableau is more than just a pretty face in the data visualization world. It’s a comprehensive analytics platform with a built-in AI engine that helps you uncover hidden patterns and answer complex questions. Its drag-and-drop interface makes it user-friendly, while its advanced analytics capabilities allow you to delve deep into your data and create stunning visualizations that tell a compelling story.
2. Polymer

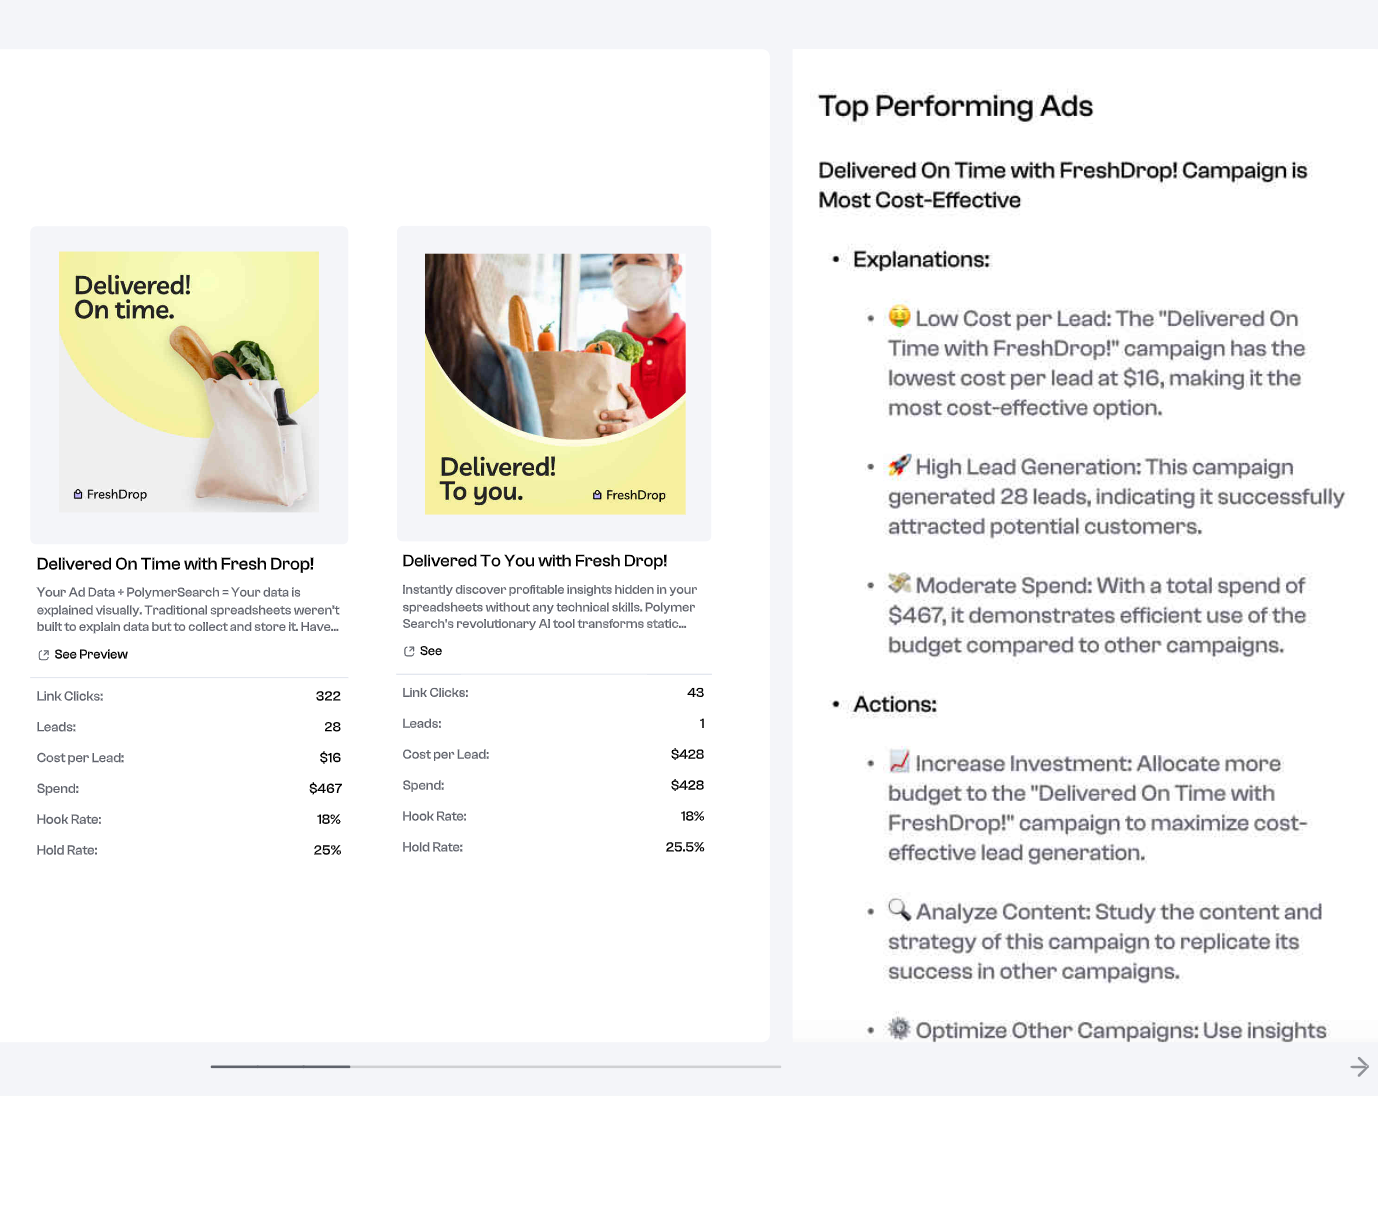
Polymer is the rising star for teams who want to transform their data into actionable insights without needing a Ph.D. in data science. Its AI-powered analysis automatically generates eye-catching dashboards that make it easy to spot trends, identify outliers, and track your key performance indicators (KPIs). With Polymer, you can make data-driven decisions faster and with confidence.
3. Akkio

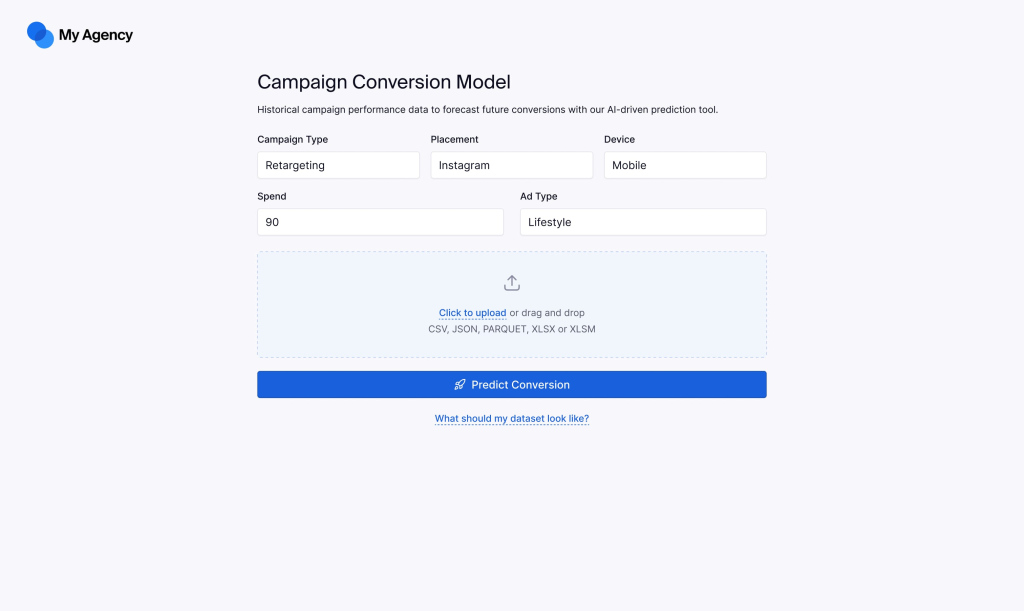
Imagine having a data scientist who speaks plain English – that’s Akkio in a nutshell. This AI-powered platform uses natural language processing (NLP) to understand your questions and generate insightful visualizations in response. It’s like conversing with your data, where you ask questions like “What are the top-selling products?” and Akkio delivers answers in the form of beautiful charts and graphs.
4. MonkeyLearn

If text is your treasure trove of data, MonkeyLearn is your ultimate tool. This AI-powered text analysis platform can extract valuable insights from customer feedback, social media mentions, and even survey responses. It automatically classifies, analyzes, and visualizes text data, helping you understand sentiment, identify trends, and discover new opportunities.
5. FuseBase

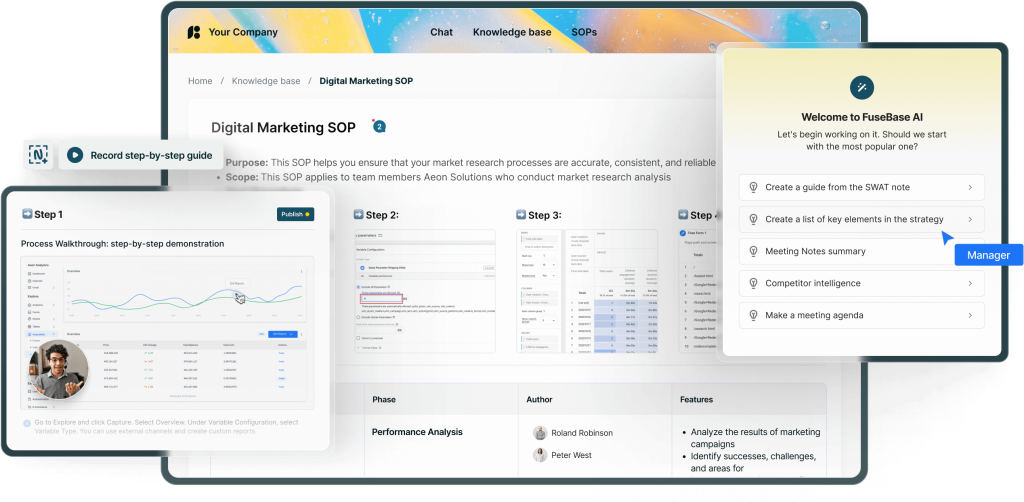
FuseBase is a unique hybrid: it’s a robust client portal and a powerful AI data analyst. Its virtual AI assistant seamlessly integrates with your internal workspaces and pages, analyzing data through natural chat interactions. It extracts actionable insights, helps you make data-driven decisions, and even streamlines client collaboration.
FuseBase may not have built-in data visualization features, but it excels in another crucial aspect: client-centric knowledge presentation. Think of it as your virtual showroom, where you can showcase your expertise, project results, and deliverables in a way that’s both professional and engaging.
Consultants, agencies, and any data-driven team working closely with clients will find FuseBase invaluable. It empowers you to create custom client portals that act as interactive hubs for project communication and file sharing. Your clients gain a secure and personalized space to access information, track progress, and provide feedback, fostering transparency and trust.
Conclusion
The age of AI-powered data visualization is here, and it’s empowering businesses of all sizes to gain a deeper understanding of their operations, customers, and market trends. By choosing the right AI tool for your needs, you can transform raw data into actionable insights, make informed decisions, and drive your business forward with confidence. So, dive into the world of AI data visualization and unlock the hidden potential within your data.

